
Marine Technology
One vehicle, one stereo pair — no pilots, no acoustic array. The mission flies itself and returns a metric map of whatever is down there: reefs, shipwrecks, pipelines, underwater infrastructure.
Mission views
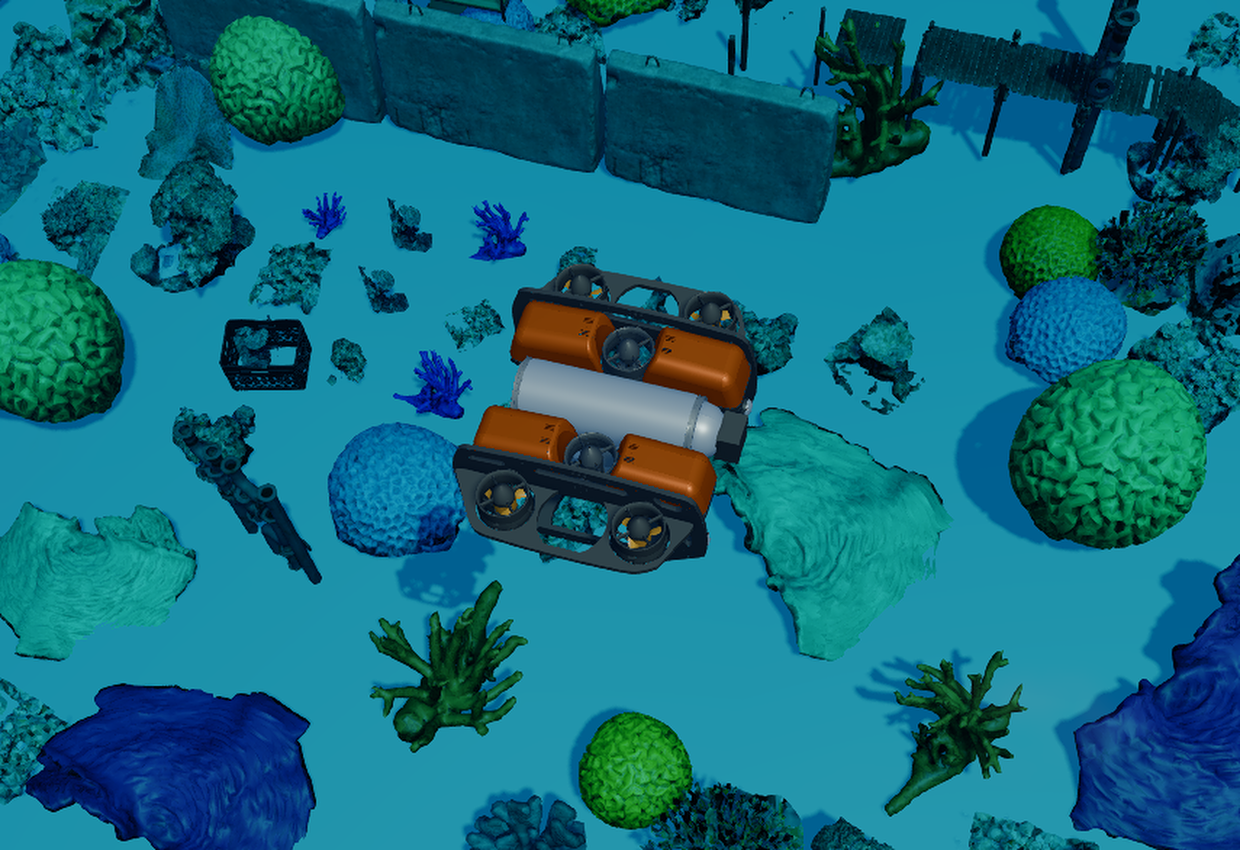
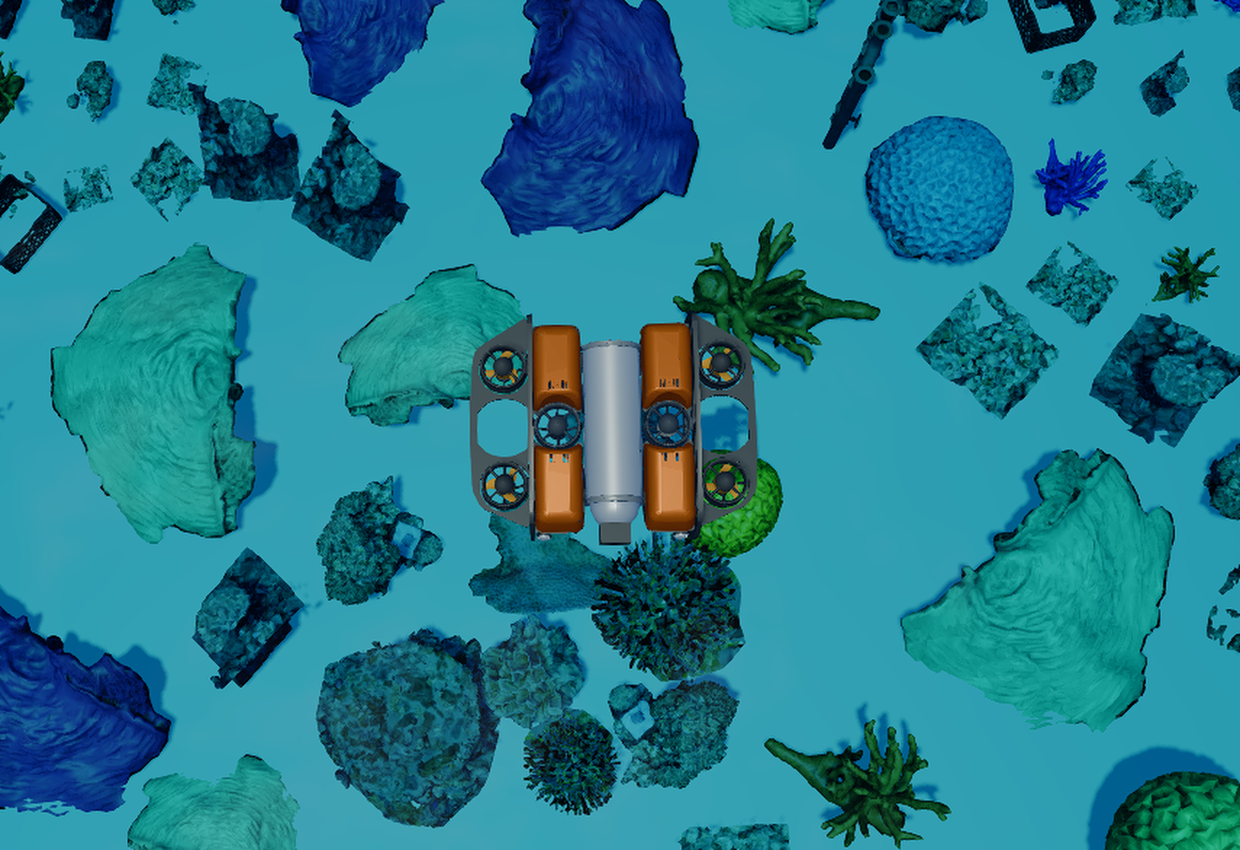
Two views of the same run — the vehicle over the survey area, and the mapping target from above.
Mission console
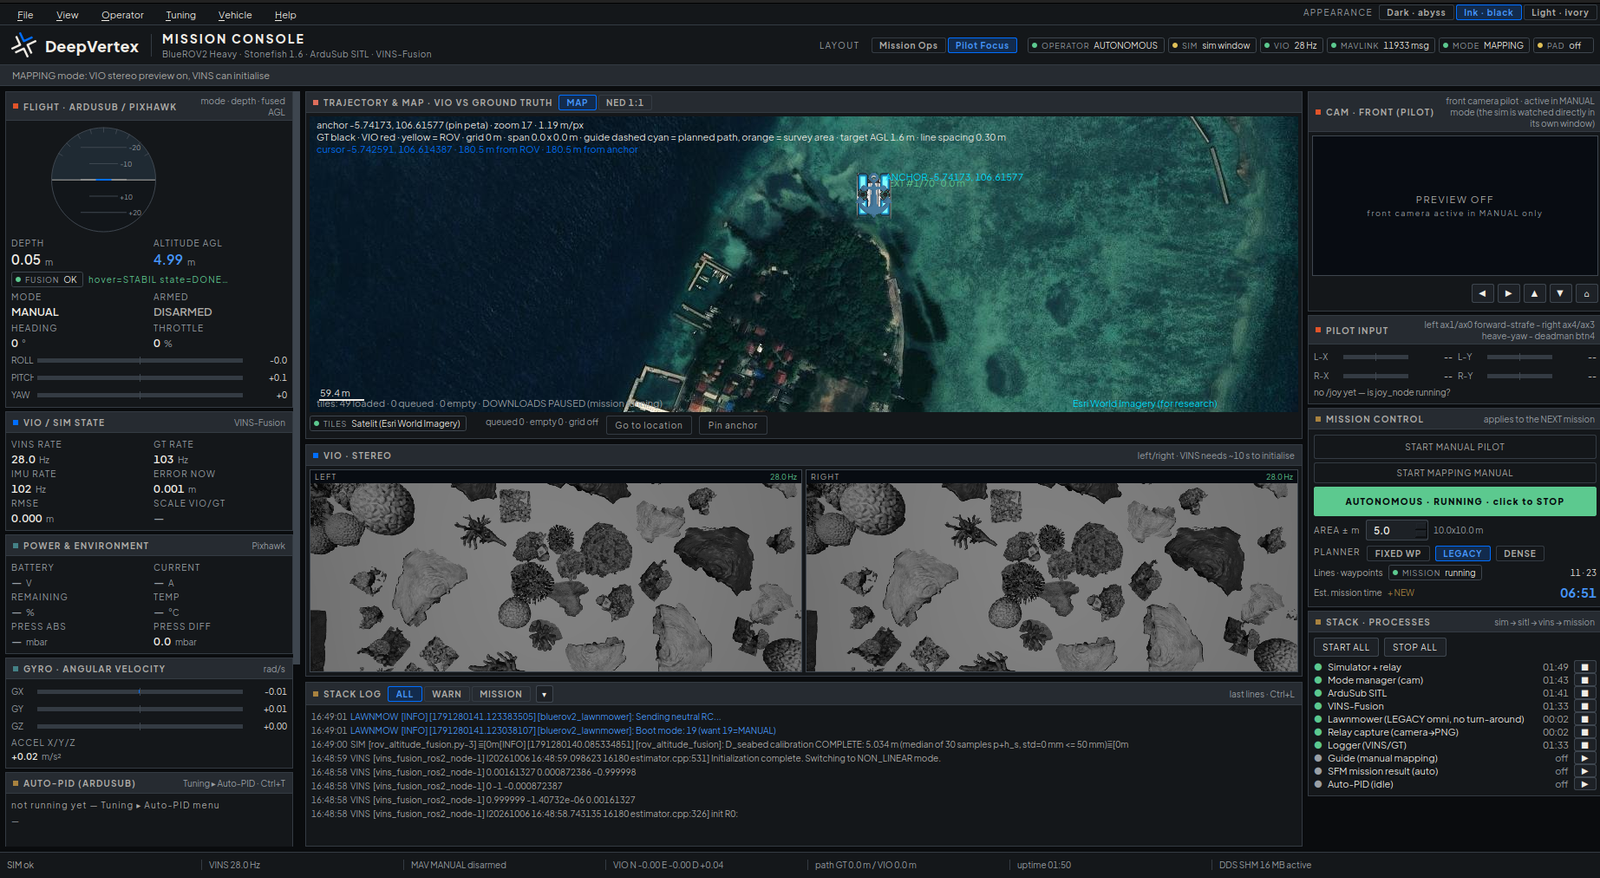
Simulator, autopilot and the mission itself — started, watched and stopped from one screen. What you see is what runs the vehicle.
One system, many missions
Coral restoration is our flagship application — the same vehicle, sensors and pipeline map any underwater subject at survey grade.
Survey-grade baselines to prove what is recovering — and what needs replanting.
Full 2D and 3D records of wrecks for research, heritage and safety.
Repeatable inspection runs without diving teams or acoustic arrays.
Monitoring for ports, offshore assets and critical undersea works.
The problem — coral first
Hard coral cover fell from 30.2 % in 1980–2009 to 27.3 % in 2020–2024. In 2024 it dropped 8.9 % in a single year — the largest one-year loss on record. Restoration is decades behind the loss, and most of it is still done by hand.
The bottleneck is not intent — it is evidence. Median restoration monitoring lasts about 12 months, far shorter than coral maturity. Without repeatable, metre-scale mapping, nobody can prove which sites are recovering — and restoration budgets keep paying for guesswork.
Sources: GCRMN, Status of Coral Reefs of the World 2025 · Costanza et al. 2014 · Boström-Einarsson et al. 2020.
How it works
No acoustic array, no topside gear, no extra vessel — the entire survey kit rides with the vehicle.
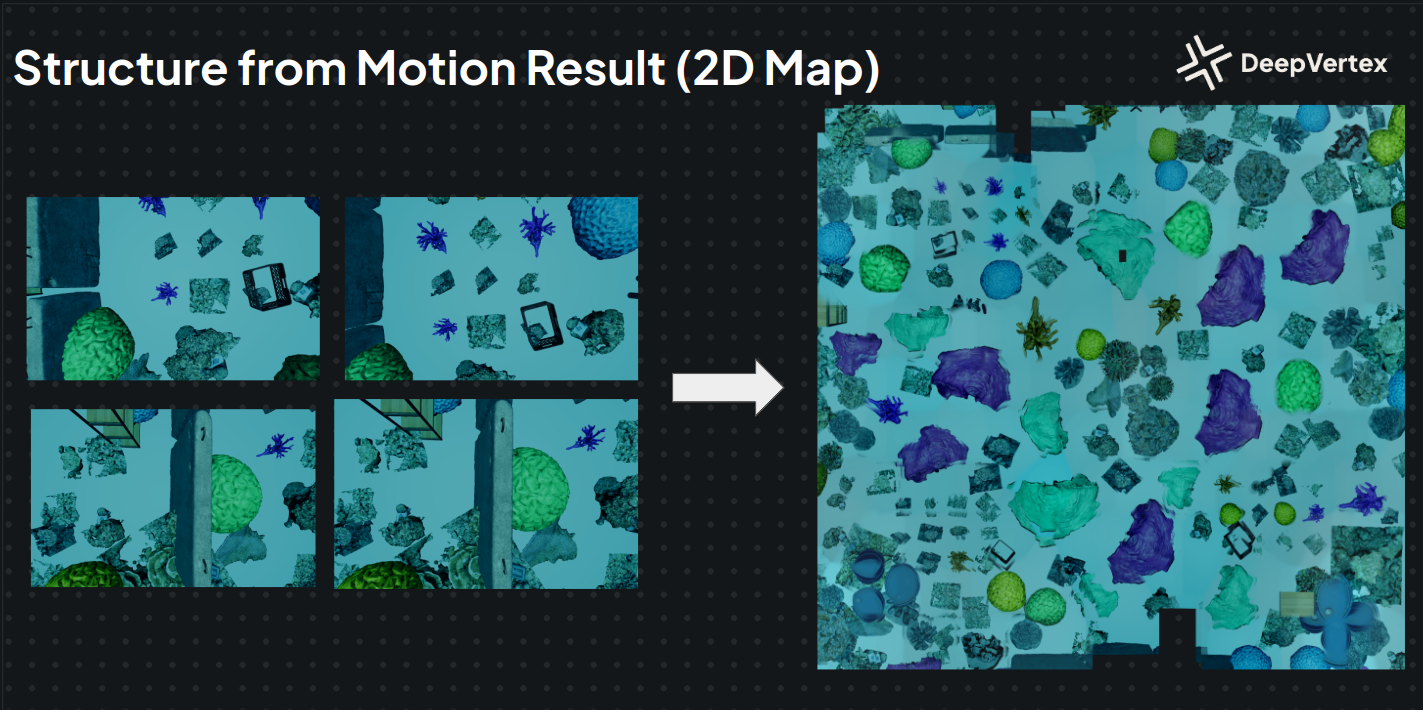
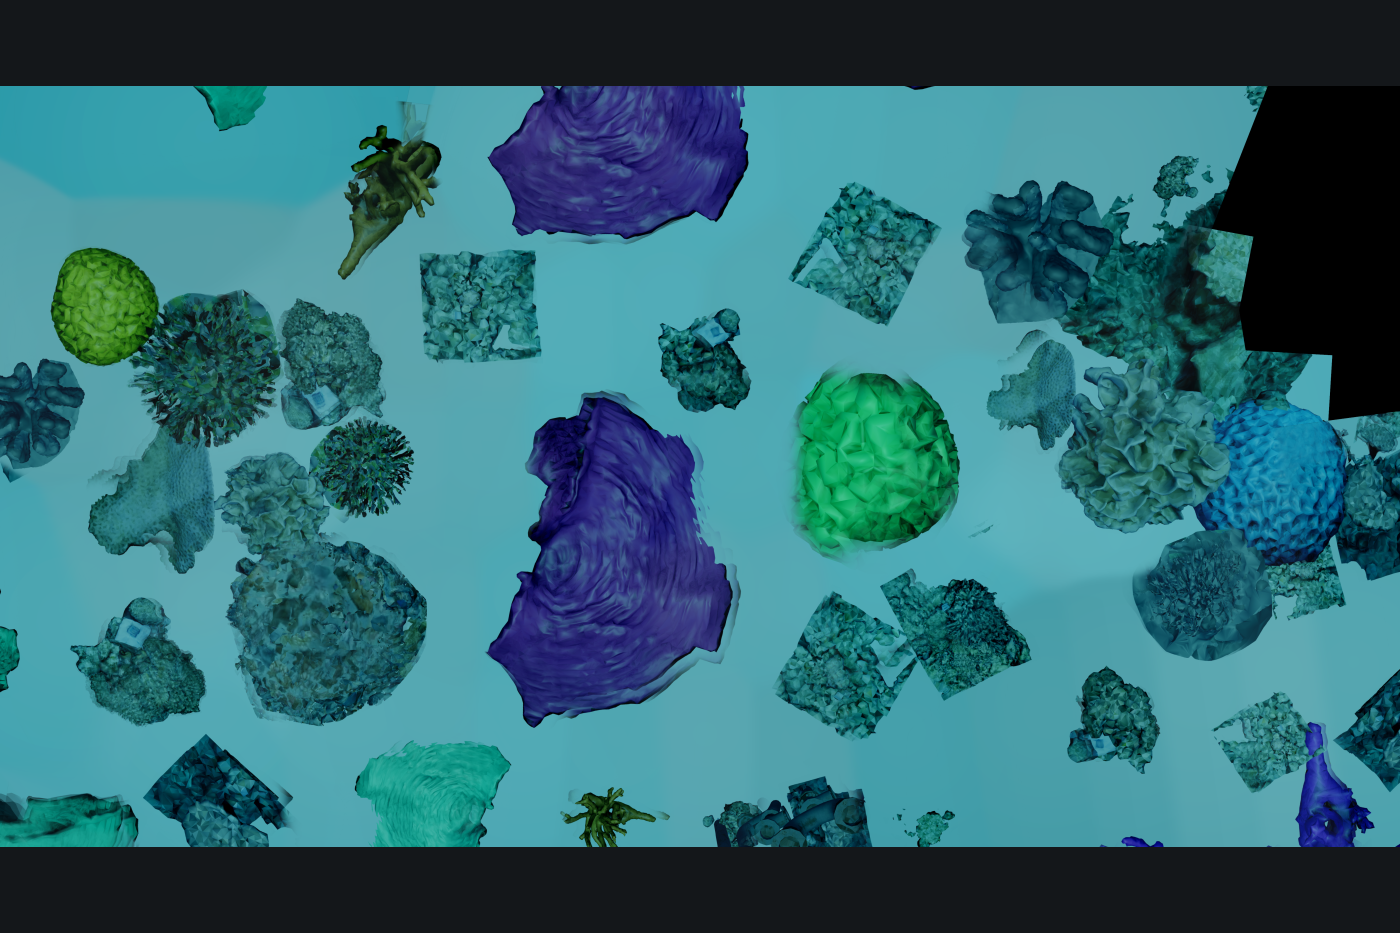
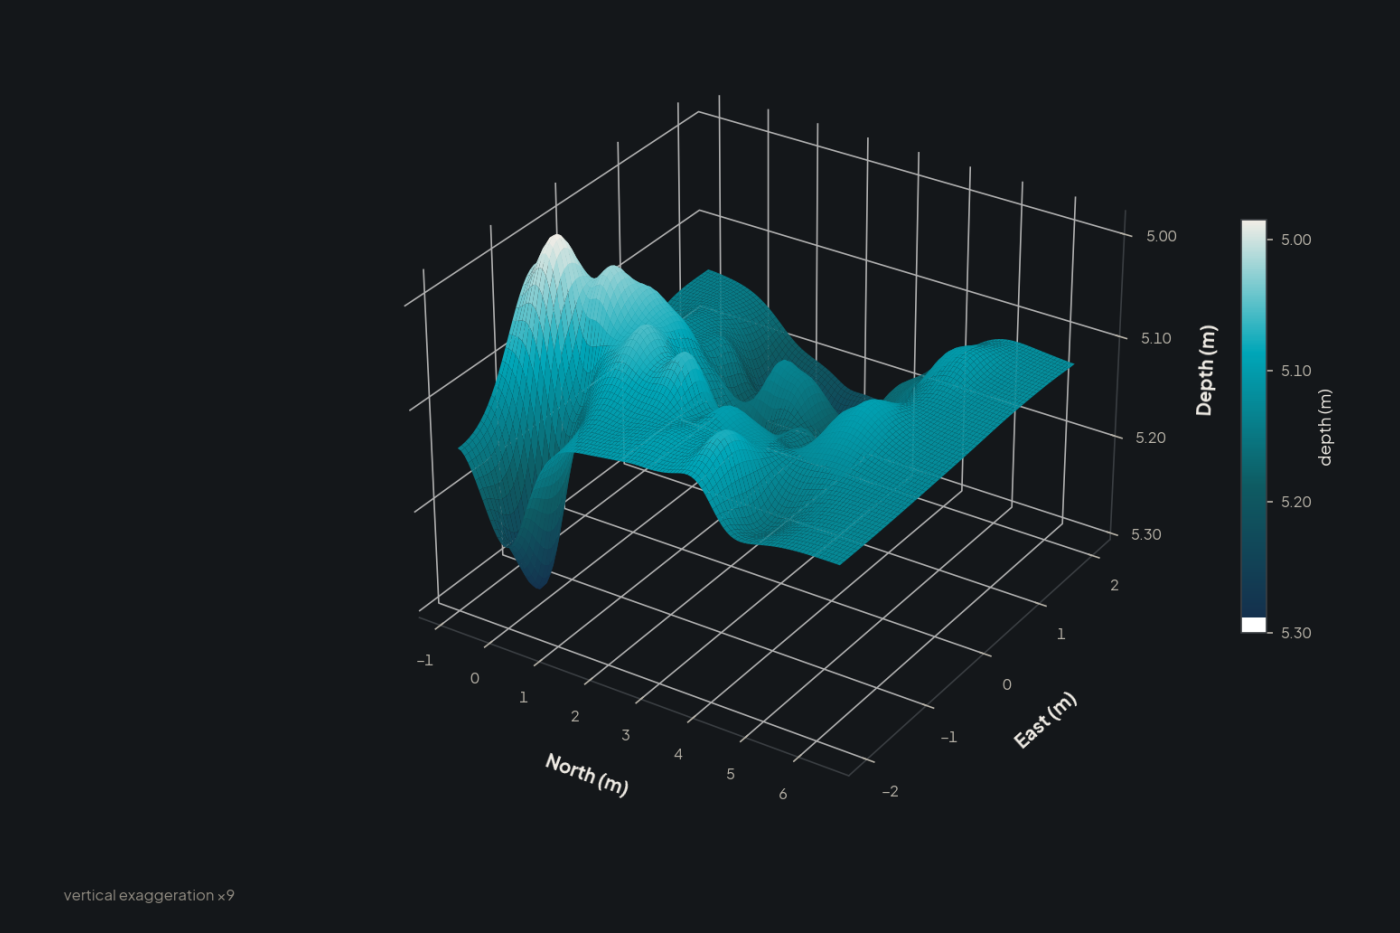
Full-resolution stills at each waypoint become a 2D orthomosaic and a 3D model. One dive, two deliverables: metrics for science, maps for decisions.
Outputs
Every mission pays twice: a live pose stream for navigation, and a permanent record of the seabed — delivered in 2D and 3D.
Why this approach
| Method | Hardware cost | Notes |
|---|---|---|
| Acoustic USBL / SBL | ~ US$10,520 | 2–4 Hz update rate; needs a topside transducer and vessel logistics. |
| Doppler Velocity Log (DVL) | ~ US$8,710 | Precise, heavy, bulky — and about 31× the cost of the stereo kit (Liu et al. 2024). |
| DeepVertex (DVX) Stereo Camera | ~ US$280 | Passive, light, and a fraction of the cost — needs camera–IMU calibration and seabed texture. |
Sources: project deck — vendor list prices, 2026 · Liu et al. 2024.
Status
The full pipeline is validated in simulation. The next milestone is a controlled pool run — 10 × 10 m area, 6 m depth — and a pressure-chamber check before open water.